Estimating herbage mass, assessing ground cover and green content are important skills to help inform on-farm decisions. This handy guide provides details for a method that provides for consistency of estimates between different people on the same farm. Click the heading to read more!
1. Herbage mass
Step 1:
Measure pasture height (in cm) from the ground to the average height of the bulk of leaves; do not extend leaves and do not measure to the top of seed heads.
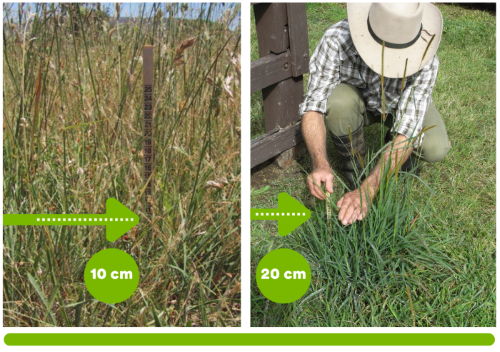
Step 2:
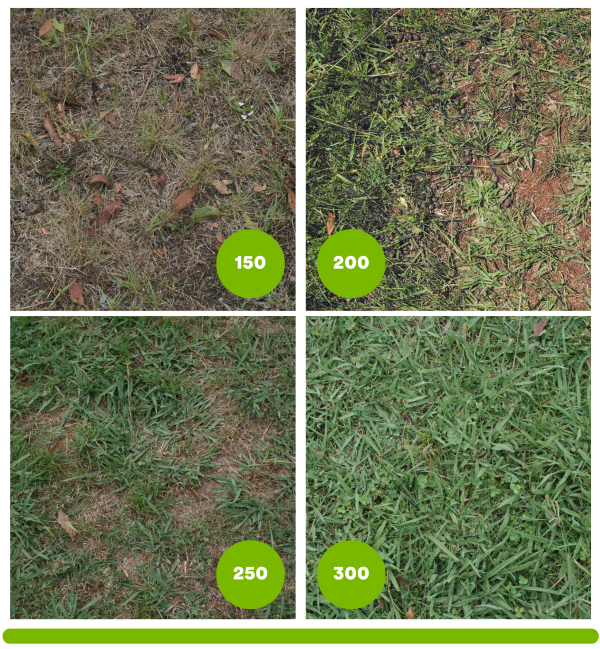
Estimate pasture density in terms of kg dry matter (DM) per hectare (ha) for every centimetre (cm) of pasture height.
|
Guide to the estimation of pasture density (kg DM/ha per cm) for temperate pastures |
|
|
Pasture density |
Description |
|
150 |
Ground readily seen through sparse pasture |
|
200 |
Ground seen through sparse pasture |
|
250 |
Ground occasionally seen through average pasture |
|
300 |
Ground not visible through average pasture |
|
350 |
Good pasture |
|
400 |
Dense pasture |
For more information please visit Ag360.
Step 3:
To calculate herbage mass multiply pasture height x pasture density
(eg. 10 cm x 250 kg DM/ha per cm = 2,500 kg DM/ha)
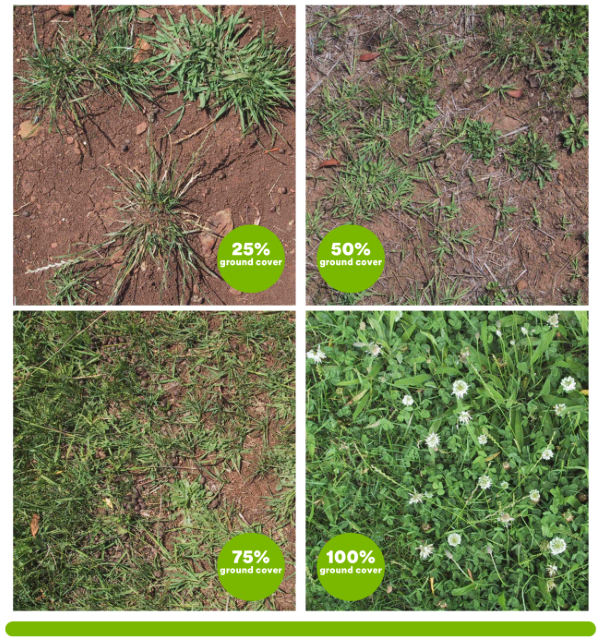
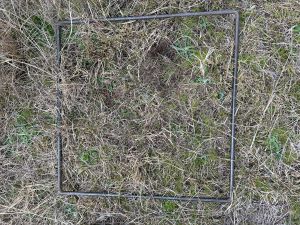
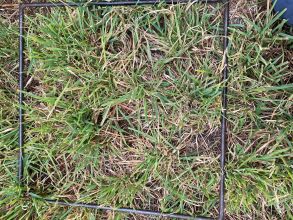
2. Ground cover
Covered ground reduces rainfall runoff, reduces weed germination, regulates soil surface temperature and conserves soil moisture.
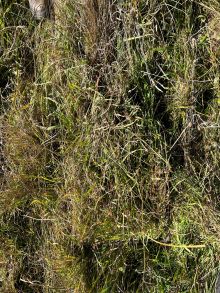
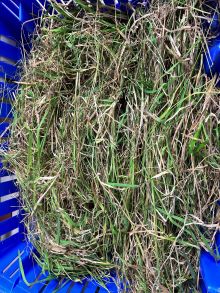
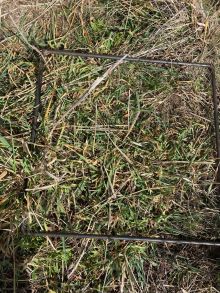
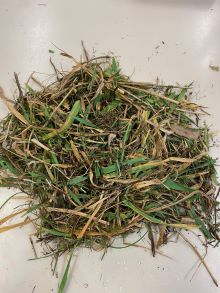
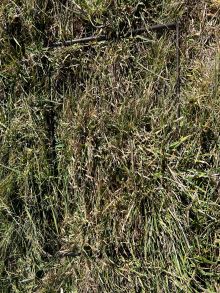
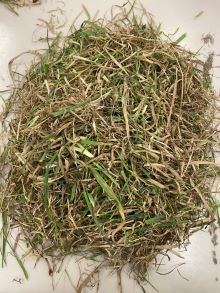
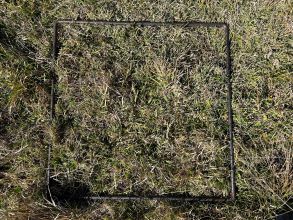
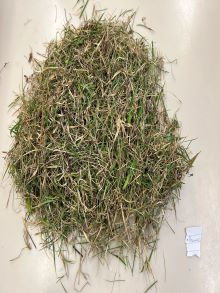
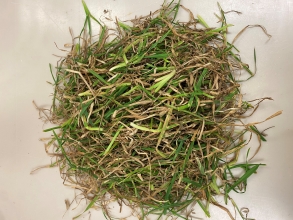
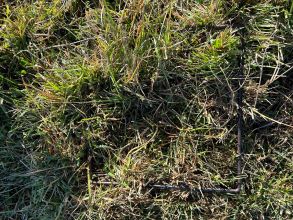
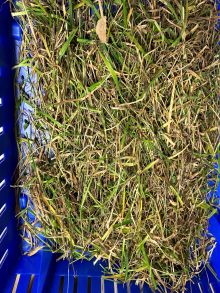
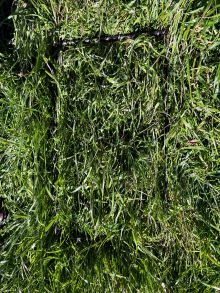
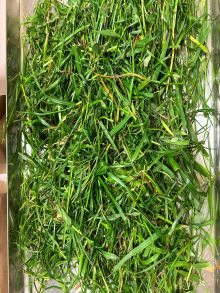
3. Green content
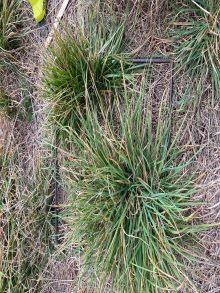
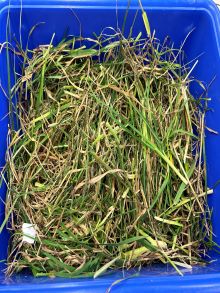
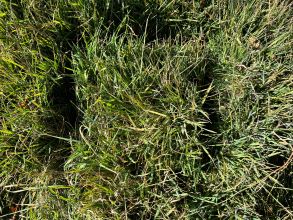
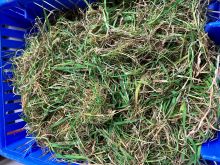
Herbage mass green content, also called green percent, is the percentage of herbage mass that is green, and is expressed on a dry matter basis following cutting and oven drying. It is easy to overestimate green percent because green leaves/stems have lower dry matter (i.e. more water) than dry/dead leaves and stems and herbage mass is expressed on a dry matter basis.
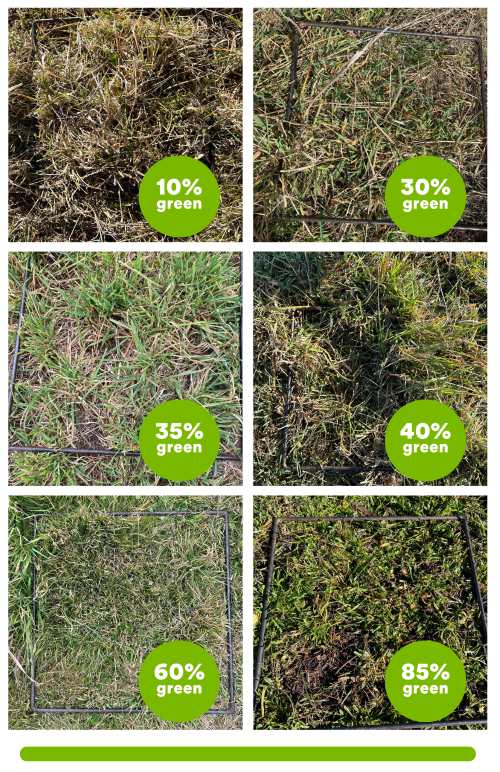
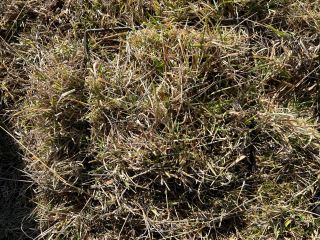
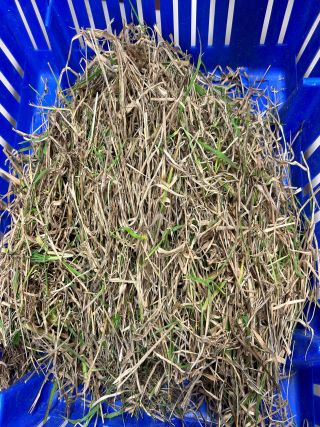
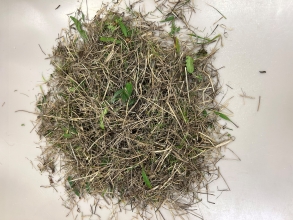
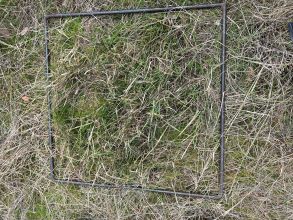
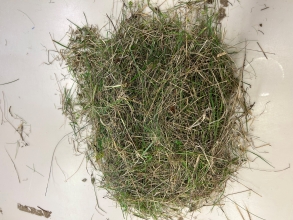
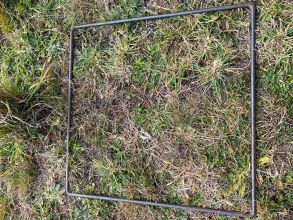
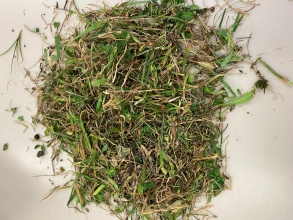
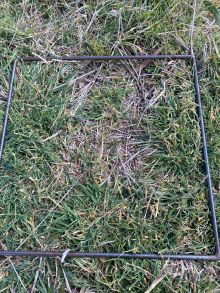
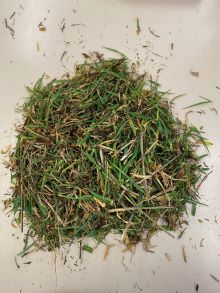
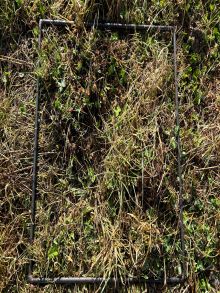
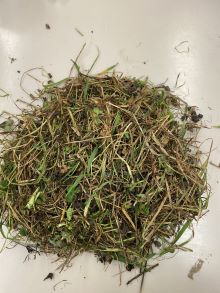
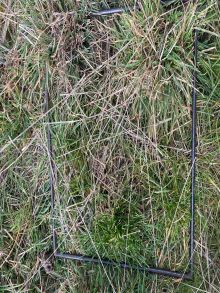
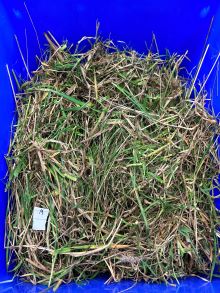
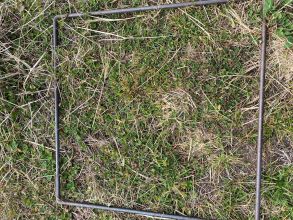
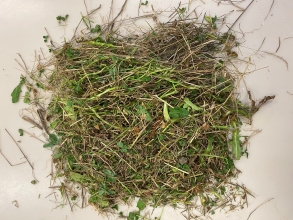
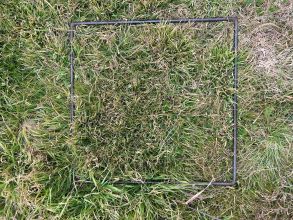
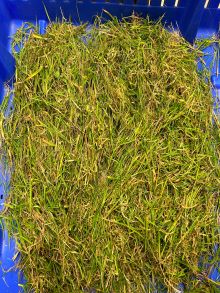
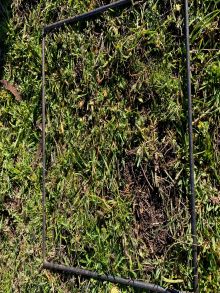
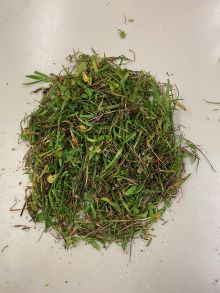
The table below provides additional examples of grass in the paddock, and the cut quadrat samples.
Green Content (% dry matter) of herbage mass |
||
12% |
 |
 |
18% |
 |
 |
22% |
 |
 |
22% |
 |
 |
22% |
 |
 |
27% |
 |
 |
27% |
 |
 |
28% |
 |
 |
29% |
 |
 |
29% |
 |
 |
30% |
 |
 |
33% |
 |
 |
35% |
 |
 |
40% |
 |
 |
48% |
 |
 |
50% |
 |
 |
61% |
 |
 |
85% |
 |
 |
96% |
 |
 |
References
Herbage mass, pasture density and ground cover materials sourced from Kahn and Earl, Pasture Management Checklist, Agricultural Information & Monitoring Services https://aimsag.com.au/software/